Business Intelligence
We've developed industry-leading tech to make your daily estimated sales viewable via an AWS QuickSight dashboard. Enabling you to keep your finger on the pulse of your business.
What can I see?
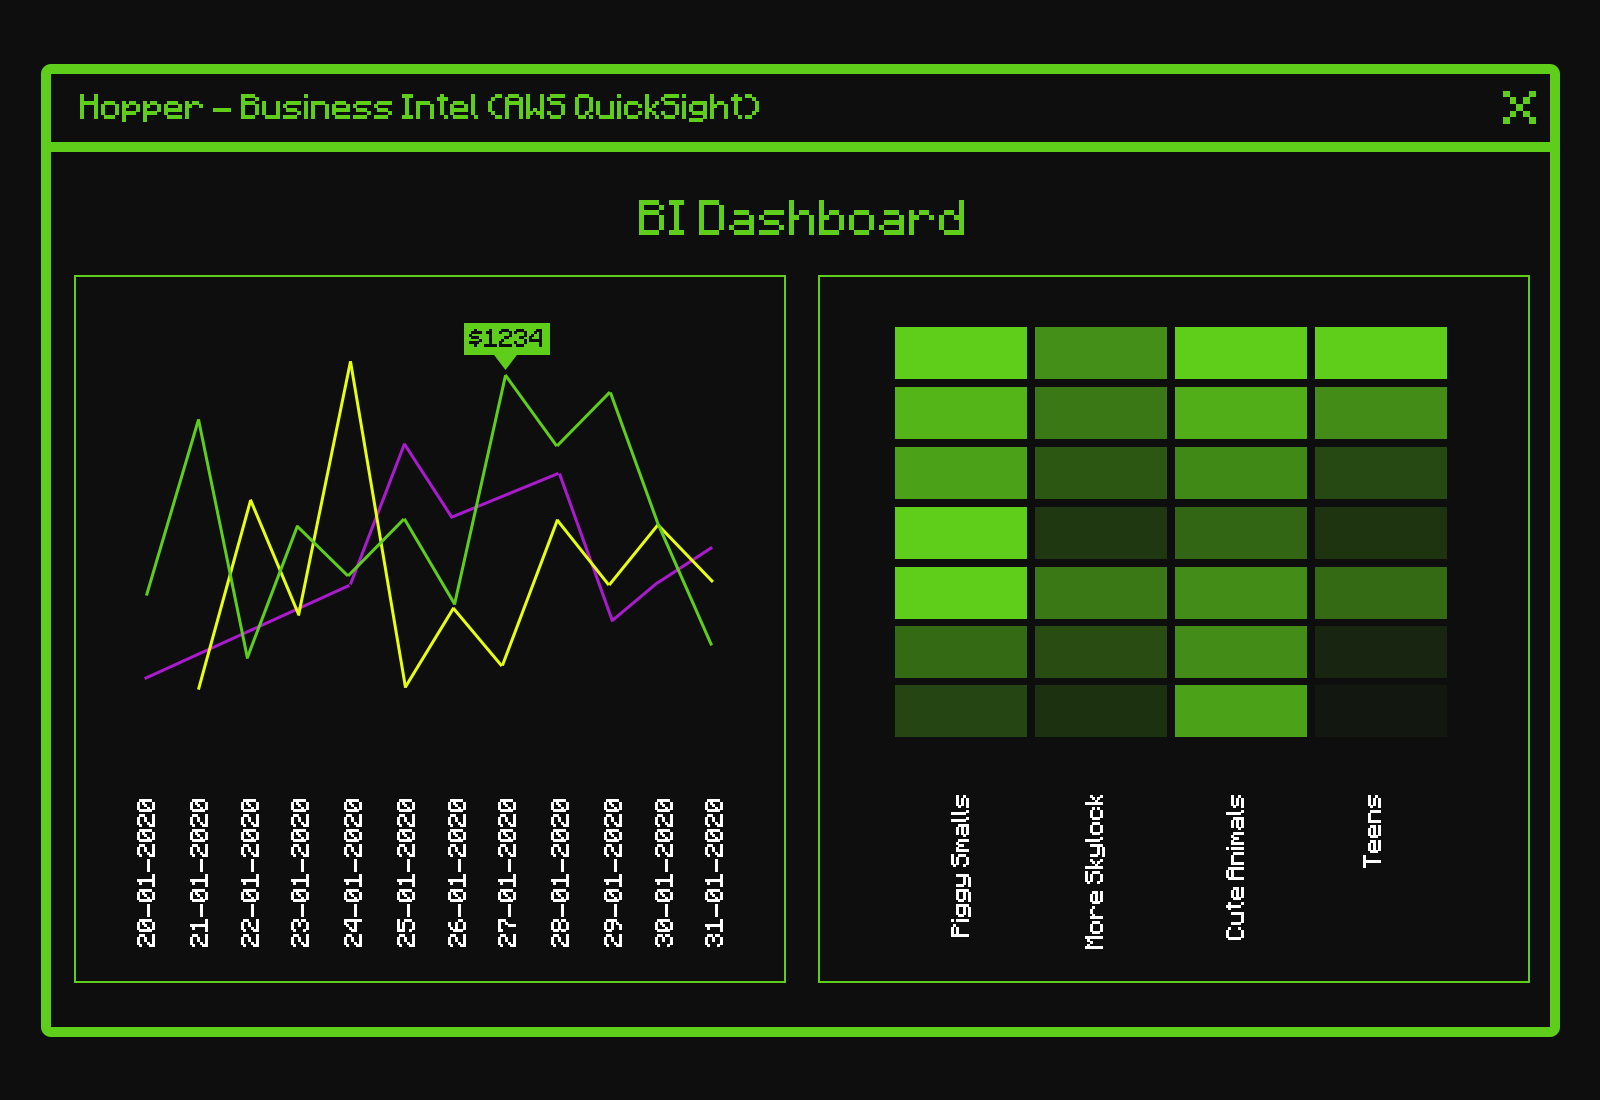
That is a great question! Our Business Intelligence Dashboard (BI Dashboard) includes:
- Estimated Royalties Last 30 days, as a table by date/product/earnings.
- Top Performing Products Last 30 days, your top earning products in a condensed table by date/product/earnings.
- Estimated Daily Royalties Chart Last 30 days, your top earning products displayed in a chart.
- Estimated Monthly Royalties Chart Your top earning products displayed in a chart, grouped by month.
- Content Heatmap Showing your content sales in a nice visual format.
- Estimated Monthly Royalties A chart showing your estimated royalties in a table by month.
- Top 3 earners A list of your best content.
- Bottom 3 earners A list of your worst selling content.
- + more
We also provide the sales data without a royalty calculation for all the above stats too.
How often does it update?
The data refreshes every 1 to 3 days (sometimes longer in exceptional circumstances). We'll send you a Discord Bot notification when your estimated sales data refreshes - so you don't need to keep refreshing in anticipation!
How do I access it?
Once we have approved you as a creator you access your BI Dashboard via a web browser, or by downloading the AWS QuickSight app for iOS/Android.
![]()
Interested in working with us?
Apply Now